
Measuring performance and building lightning web apps
21 July, 2020
6 mins
 Source: https://unsplash.com/@jon_chng
As web developers, we intend to deliver best user experience over the internet, in the process of doing so we come up with new ideas and designs to make our work more interactive and creative to users. But in doing so what we misjudge is that user experience is not all about the looks and design, but it is more than that, it also about accessibility and availability. To expect more visits and longer sessions from our users we can’t just rely only on the presentation & content of our web app, it should perform too, to user's expectations. The user's expectations are persuaded by what they are experiencing over the internet, so as a responsible developer we should meet those standards.
So what are the standards then? Because we know that performance is relative. How we make a claim that whether our web app is performing or not?
How to Measure Performance?
When talking about the performance, we generally speak in terms of time
- How much time does it take for our page to load,
- Time taken to perform an action requested by the user
, but there are many nuances to it.
How much time is enough for the user to wait, or what content can be considered meaningful, when the first time user interacted with the content, what was reaction time to that interaction? To find answers to all these questions we measure, to measure we use tools, that provide us with stats that are more meaningful to the developer. These stats help us identify the issues with our web app, the reason behind poor performance. The most common, easy to use and popular of all the performance measuring tools is the Lighthouse by Google.
Lighthouse
The Lighthouse provides audits for performance, accessibility, PWA, SEO, and more. A report is generated for every lighthouse run. The performance measured by the lighthouse is distributed over many metrics, each of them has a respective contribution towards the performance score calculation. For any metric score which is not good as per Google standards, Lighthouse provides references to optimize your app. Lighthouse is also able to provide more relevant and actionable advice depending on the tools/tech used for development.
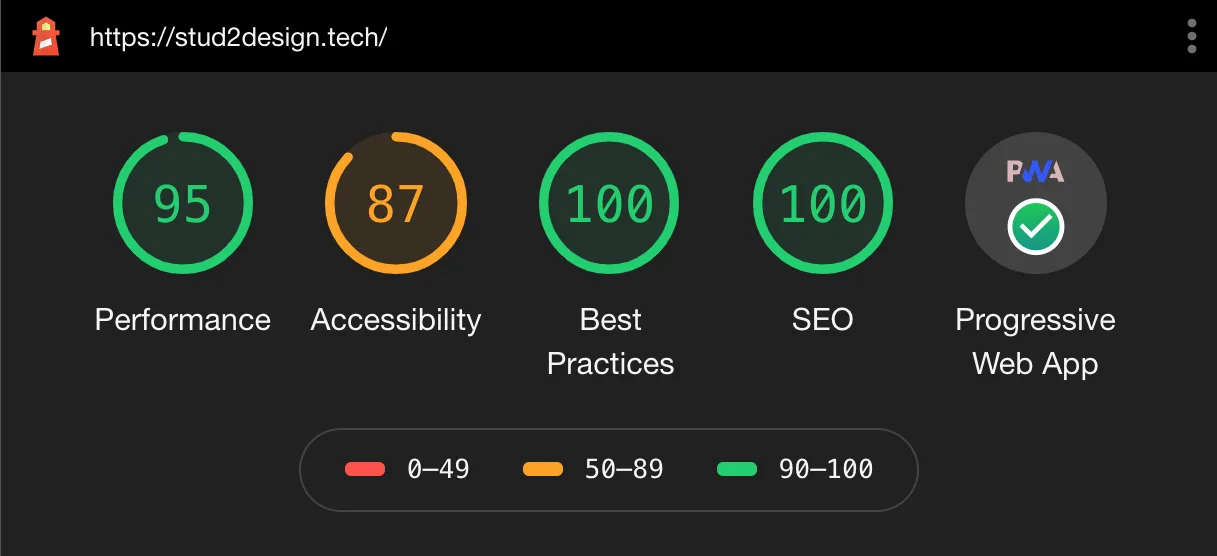
Lighthouse report's scores screenshot
One can use lighthouse in the following ways
- Directly from Google Dev Tools
- Using Chrome and Firefox extensions.
- Using NPM module
- From Command Line.
Google put great analysis and research behind metrics used for calculation of performance scores. Every metric calculated is significant to page speed and page experience. Over time Google has updated the stats available for performance calculation. The Lighthouse performance testing was initially inclined towards page speed, they now have made changes to weightage in-page experience also. The latest release of Lighthouse v6 uses a different set of metrics from successor v5. The newly added stats to v6 are now more inclined towards user experience, and factors in the metrics that matter most to users. You can find how the score is calculated in the lighthouse at scorecalc
Core Web Vitals
Core web vitals are the three parameters that were introduced by Google to provide unified guidance and of which two are an addition to the latest Lighthouse v6. The Core web vitals are considered to be more user-centric and tend to measure real-world experience. These parameters will be evolving in the future as Google revaluates them over time as data is analyzed, users' behavior is monitored and development practices are updated.
Currently, core web vitals metrics include
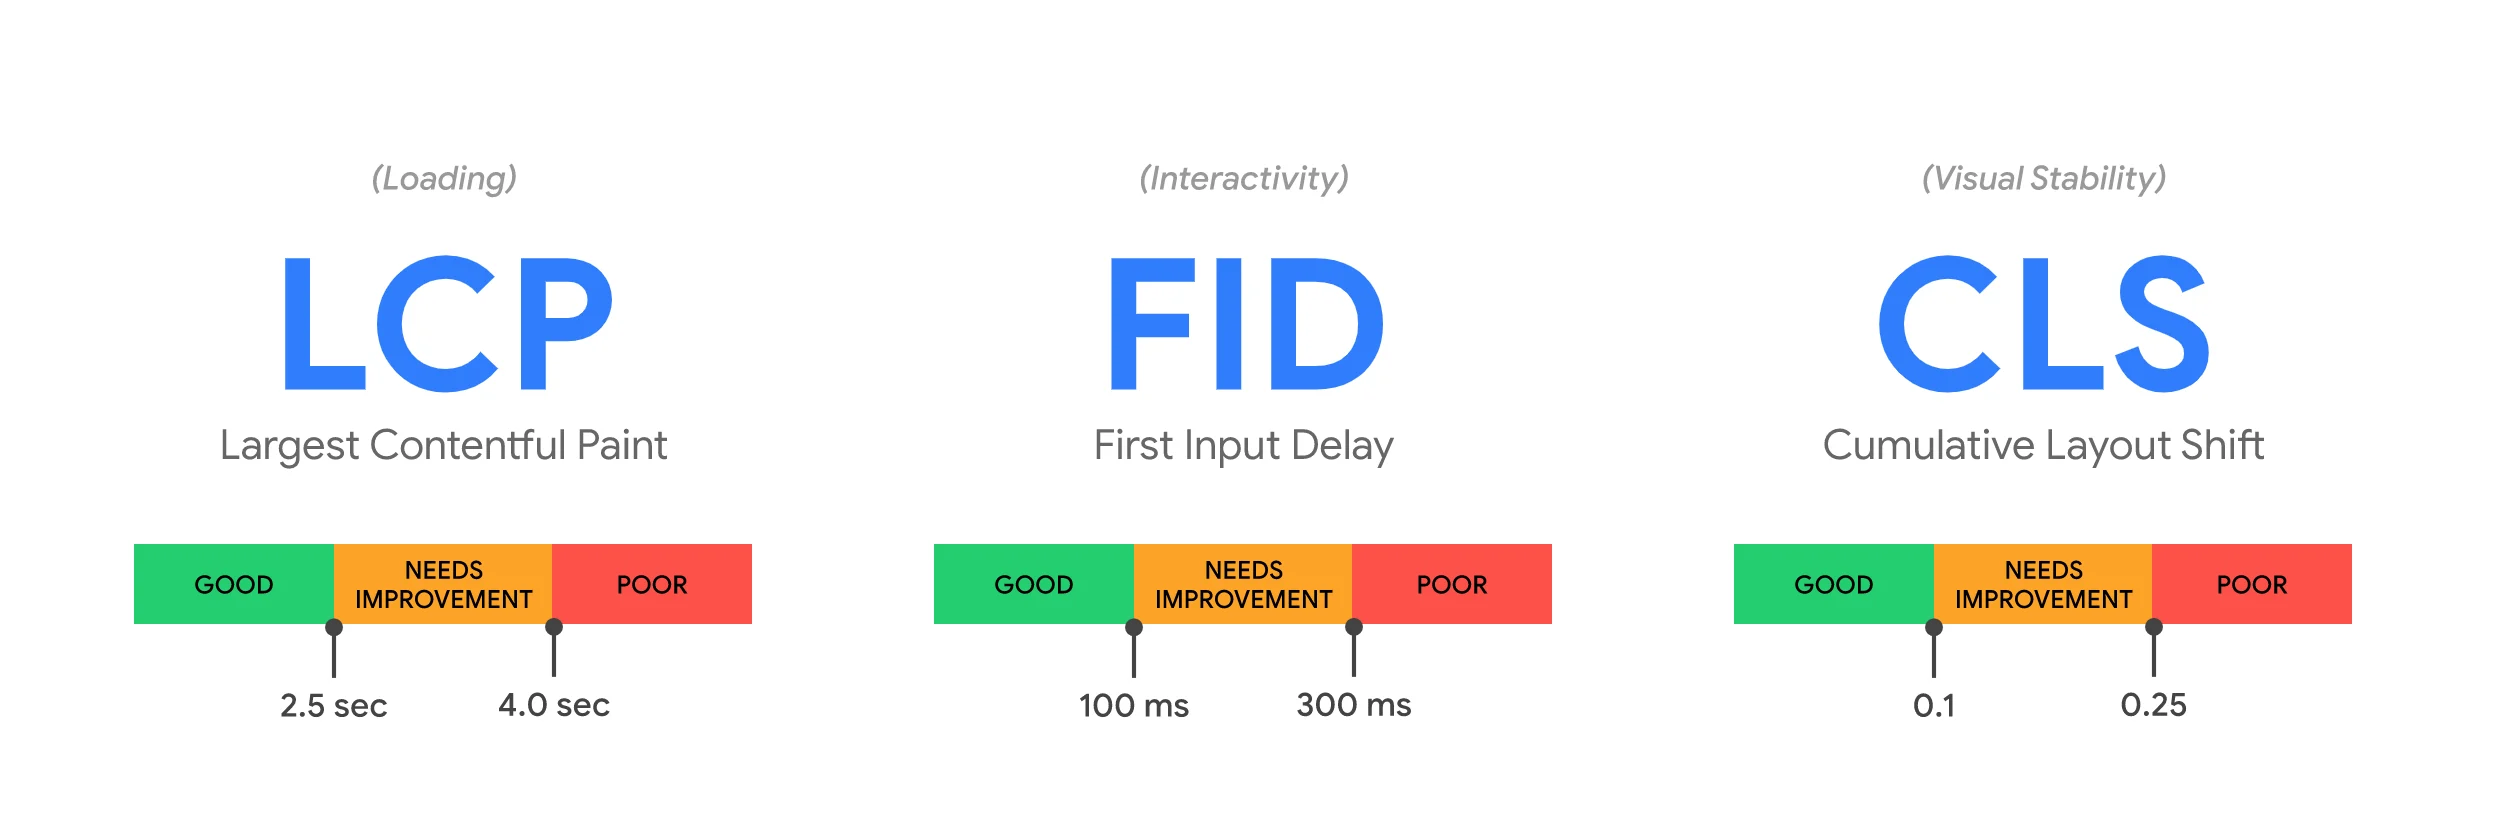
Largest Contentful Paint (LCP) : measures loading performance. As websites are loaded in stages, we need to know when meaningful content is available for users to consume. The Largest Contentful Paint (LCP) metric reports the render time of the largest image or text block visible within the viewport, so showing loader is not good enough. LCP metric is updated for every element update happening in the viewport.
First Input Delay (FID) : measures interactivity. FID measures the time from when a user first interacts with a page to the time when the browser can begin processing event handlers in response to that interaction. This includes interaction like opening a menu, entering data to input fields or button click, or even scrolling in case of pages like a blog post.
Cumulative Layout Shift (CLS) : measures visual stability. CLS measures the total of all individual layout shift scores for every unexpected layout shift that occurs during the entire lifespan of the page. A layout shift occurs any time a visible element changes its position from one rendered frame to the next.
Unlike the Lighthouse where we generate a report for a page of our site, we can measure core web vitals live for every page load happening on our browser with real-time updates, so we know now which page needs little care.
You can use the extension (https://goo.gle/vitals-extension) created by Addy for web vitals metrics information.
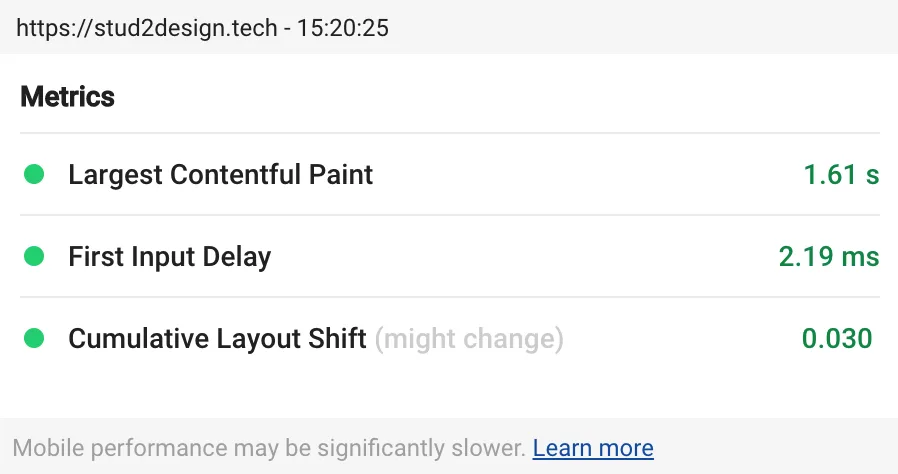
We can also use the web-vitals javascript library in our project for real user monitoring.
1import { getCLS, getFID, getLCP } from 'web-vitals';23function sendToAnalytics(metric) {4 const body = JSON.stringify(metric);5 // Use `navigator.sendBeacon()` if available, falling back to `fetch()`.6 (navigator.sendBeacon && navigator.sendBeacon('/analytics', body)) ||7 fetch('/analytics', { body, method: 'POST', keepalive: true });8}910getCLS(sendToAnalytics);11getFID(sendToAnalytics);12getLCP(sendToAnalytics);
Optimize
Once we have measured the performance per page using all three core web vitals metrics, the next step is to optimize our page with the score available to us.
To optimize is to reduce.
Less of everything, less of JavaScript, less of network resources, less of the main thread, less of render time. - Justin Ribeiro
On road to optimization, you can use the following tips from industry experts
- Data Fetching: Make sure you are using nearby CDN and the data processing is fast and response time for your request is low.
- JS: Minimize or defer JS, remove any non-critical third-party scripts, establish third-party connections early using reconnect and prefetch.
- Image: Provide dimensions for images, implement lazy loading and adaptive images.
- Caching: Use caching for static assets, this helps content load faster on subsequent page visits from users.
I would highly recommend going through the following guides from Google that offer specific detailed recommendations for how to optimize our pages for each of the Core Web Vitals:
Conclusion
To deliver the best user experience from our web app, we have to factor in performance along with the fancy UI. Performance is best dealt with when it is measured, make sure to measure how it is responding to all the users whether it is the user with a requirement of accessibility, or user having poor network condition or one using not so high-end mobile device, as every user counts.
Resources


